ATMOSPHERIC SCIENCE · DATA ASSIMILATION

Heatwave
& Data Assimilation

Two experiments. One question: when and where does Data Assimilation matter most?

EXP 01
Time Comparison
2021 vs 2024 · Normal vs Heatwave
EXP 02
Spatial Comparison
Seoul/Gyeonggi vs Gangwon · Dense vs Sparse
YEAR2021 · 2024
METHODEnKF
DATAERA5 + ASOS
REGIONSSE · GW
TEAMDajeong Yun · Faty Eyang · Minji Kang · Geonhyo Kim
SCROLL

01 · INTRODUCTION

Why Heatwaves Matter

Heatwaves are prolonged periods of abnormally high temperatures that can cause severe human and economic damage. As climate change accelerates, heatwaves are becoming more frequent and intense, making accurate forecasting increasingly important.
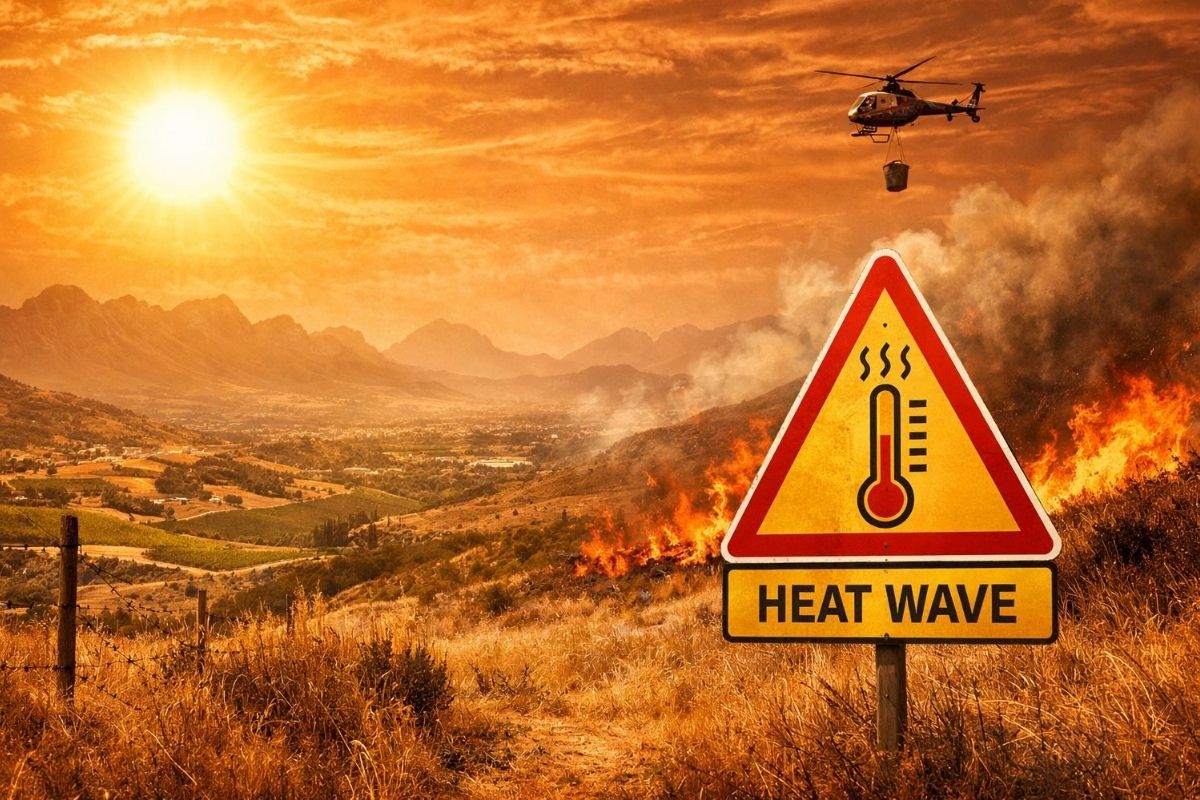
Heatwave illustration
EXTREME HEAT EVENT · Heatwaves pose severe risks to public health, agriculture, and infrastructure
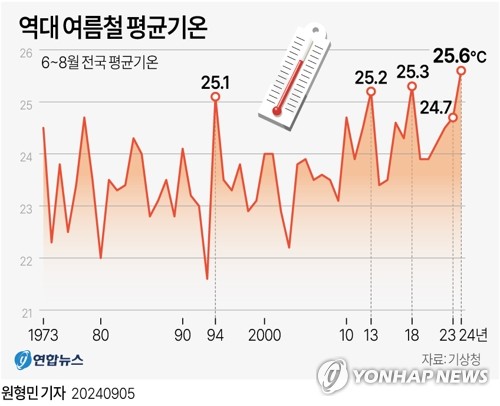
Korea summer temperature trend
SOURCE: KMA / YONHAP NEWS · Average summer temperature (June–August) since 1973. 2024 recorded 25.6°C — highest on record.
🔥
2024 South Korea Heatwave
In 2024, South Korea experienced its hottest year on record since 1973. Extreme heatwaves and tropical nights persisted into September, causing widespread impacts on agriculture, public health, energy demand, and disaster safety.
→ This motivated our study of DA effectiveness during extreme heat events.

Experimental Design

This study compares two dimensions: time (2021 vs 2024) and space (Seoul/Gyeonggi vs Gangwon) to investigate how DA performs under different heatwave intensities and observation network densities.

EXPERIMENT 01
Time Comparison
How does DA performance change between a normal year and an intense heatwave year?
YEARS
2021 — Normal Year 2024 — Heatwave Year
REGIONS
SE · Seoul/Gyeonggi GW · Gangwon
DATASETS
ctrl_subset_2021_da_input.csv
ctrl_subset_2024_da_input.csv
EnKF_core.py
RESEARCH QUESTIONS
· How do model errors evolve during heatwave events?
· Does DA become more effective under stronger atmospheric instability?
EXPERIMENT 02
Spatial Comparison
How does observation network density affect the effectiveness of DA during heatwaves?
YEAR
2024 — Heatwave Year
REGIONS
SE Seoul/Gyeonggi — observation-dense
GW Gangwon — observation-sparse
METHOD
Matrix-based DA (OSE)
Observing System Experiment · spatial covariance via distance-based Gaussian · H = I assumption
DATASETS
exp_se_2024_da_input.csv
exp_gw_2024_da_input.csv
EnKF_core.py
RESEARCH QUESTIONS
· How does observation density affect DA performance?
· Does a denser network produce more accurate heatwave predictions?
📊
Background Data
ERA5 reanalysis (ECMWF). Provides gridded atmospheric state as the model background (x^b).
📡
Observation Data
ASOS surface observations from KMA. Ground truth for DA innovation calculation.
🔄
DA Method
Ensemble Kalman Filter (EnKF). Ensemble size = 50, obs error std = 1.0, inflation = 1.1.
02 · DA THEORY

Data Assimilation Background

DA is a mathematical framework that optimally combines a model background with real-world observations — giving more trust to whichever source is more reliable — to produce an improved estimate of the true atmospheric state called the analysis field.

Background x_b
Model's prior forecast. Here: ERA5 reanalysis (~31 km, hourly) from ECMWF.
Observation y_o
Real surface measurements. Here: ASOS station data from KMA across South Korea.
Analysis x_a
Optimal blend of background + observations. Becomes the initial condition for the next forecast.
Analysis Update
x_a = x_b + K(y_o - H(x_b))
The innovation (y_o - H(x_b)) measures how far the model deviates from observations. K determines how much to trust the observations.
Kalman Gain (EnKF)
K = P_b H^T (H P_b H^T + R)^-1
EnKF estimates P_b dynamically from ensemble spread rather than prescribing it statically — capturing flow-dependent errors. Large P_b → K increases → observations trusted more.

Observation Density & DA Performance

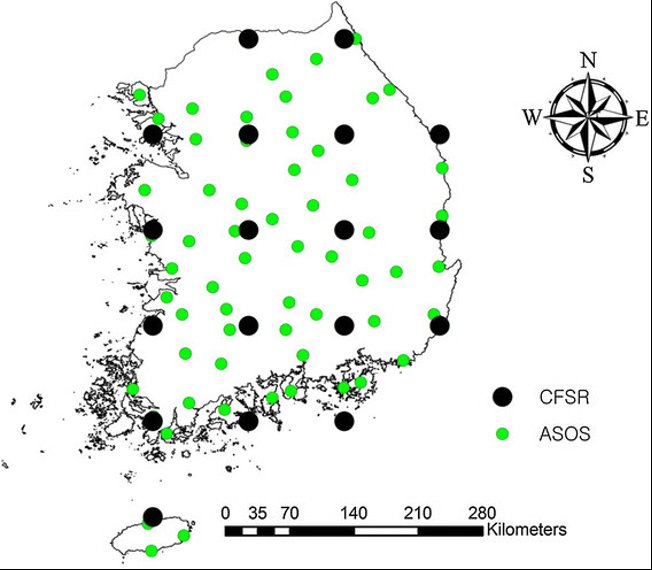
Dense observation networks allow DA to constrain the analysis field more tightly, reducing background errors more effectively. In sparse regions, the system relies more heavily on the model background — leaving initial condition errors less corrected.

This study directly tests this by comparing Seoul/Gyeonggi (SE) — observation-dense — against Gangwon (GW) — observation-sparse — during the 2024 heatwave.

ASOS and CFSR stations over South Korea
ASOS stations (green) and CFSR grid points (black) over South Korea. Note denser coverage in SE vs. sparse GW.

03 · METHOD & TEAM

Research Method & Role Distribution

The team of four divided responsibilities across data pipeline, core algorithm, temporal analysis, and spatial analysis — each building on a shared EnKF framework.

A — Dajeong Yun
Data Pipeline
DATA COLLECTION & PREPROCESSING
  • Downloaded ERA5 data via CDS API
  • Collected ASOS observations from KMA portal
  • Korea domain cropping, unit conversion, missing value handling
  • Configured shared Google Drive workspace
B — Faty Eyang
EnKF Core
ALGORITHM IMPLEMENTATION
  • Implemented Kalman gain calculation
  • Developed ensemble generation and update logic
  • Built reusable EnKF modules for team-wide experiments
  • Designed common framework for all experiments
C — Geonhyo Kim
Time Analysis
EXPERIMENT 1 · TEMPORAL COMPARISON
  • Added perturbation experiment modules
  • Compared normal year (2021) vs heatwave year (2024)
  • Conducted SE and GW ensemble experiments
  • Visualized RMSE time series
D — Minji Kang
Spatial Analysis
EXPERIMENT 2 · SPATIAL COMPARISON
  • Implemented OSE (Observing System Experiment) module
  • Compared dense vs sparse observation networks
  • Conducted SE vs GW experiments
  • Visualized analysis increment maps

04 · RESULTS

DA Performance Analysis

Results from two experiments: time comparison (2021 vs 2024) and spatial comparison (SE vs GW during 2024 heatwave).

Comparing DA performance between normal year (2021) and heatwave year (2024) across SE and GW regions.

Seoul / Gyeonggi (SE)
Observation-dense · 2024 Heatwave
Background RMSE0.9939 °C
Analysis RMSE0.7560 °C
Improvement Rate23.93%
Mean Increment-0.219 °C (overestimation)
Mean Abs. Increment0.376 °C
Gangwon (GW)
Observation-sparse · 2024 Heatwave
Background RMSE1.9557 °C
Analysis RMSE1.4927 °C
Improvement Rate23.67%
Mean Increment+0.692 °C (underestimation)
Mean Abs. Increment0.843 °C

05 · CONCLUSION

Key Findings

When atmospheric conditions are most extreme and observation networks are most sparse, observational data becomes most valuable — but its impact is fundamentally limited by how many observations are available.

06 · LIMITATIONS

Limitations

Ensemble Collapse
Ensemble spread consistently decreased over time despite covariance inflation (factor = 1.1), suggesting the EnKF did not operate under fully ideal conditions throughout the experiment.
Time-Independent DA
Assimilation was performed independently at each time step without temporal continuity. Real NWP systems propagate analysis states forward using a forecast model, which was not implemented here.
H = I Assumption
The observation operator was assumed to be the identity matrix, implying ERA5 grid points and ASOS station locations perfectly coincide — which is a simplification of reality.
Small Effect Size
The difference in RMSE Reduction between 2021 and 2024 is approximately 0.6%p. Statistical significance was not formally tested, and the effect may not be robust under different ensemble configurations.

07 · EXTENDED INTERPRETATION

Why Did SE and GW Respond Differently?

Both experiments point to the same underlying cause: ERA5 has fundamentally different bias characteristics in urban vs. mountainous regions.

SE — ERA5 Overestimates
Increment = −0.219°C · RMSE 2024 < 2021

ERA5's ~31km grid averages Seoul's dense urban core with surrounding suburban areas, systematically overestimating temperature. During the 2024 widespread heatwave, the urban–suburban gradient narrowed, reducing ERA5's overestimation bias.

Lee et al. (2024, GRL) — ERA5 overestimates urban LST by avg. 1.63°C and fails to capture urban heat island intensity.
GW — ERA5 Underestimates
Increment = +0.692°C · RMSE 2024 > 2021

Gangwon's Taebaek range produces sharp elevation gradients and föhn-driven temperature surges that ERA5 cannot resolve. During the 2024 heatwave, these localized extremes intensified, widening the background error.

Zou et al. (2022) — ERA5-Land underestimates temperature by −0.9°C to −2.0°C in complex mountainous terrain.

Key Insight: The opposing increment directions and asymmetric RMSE trends both reflect the same structural truth — ERA5 overestimates in urban regions and underestimates in mountainous terrain. DA corrects these biases, but magnitude and direction differ by region.

08 · REAL-WORLD IMPLICATIONS

How KIM Addresses Our Limitations

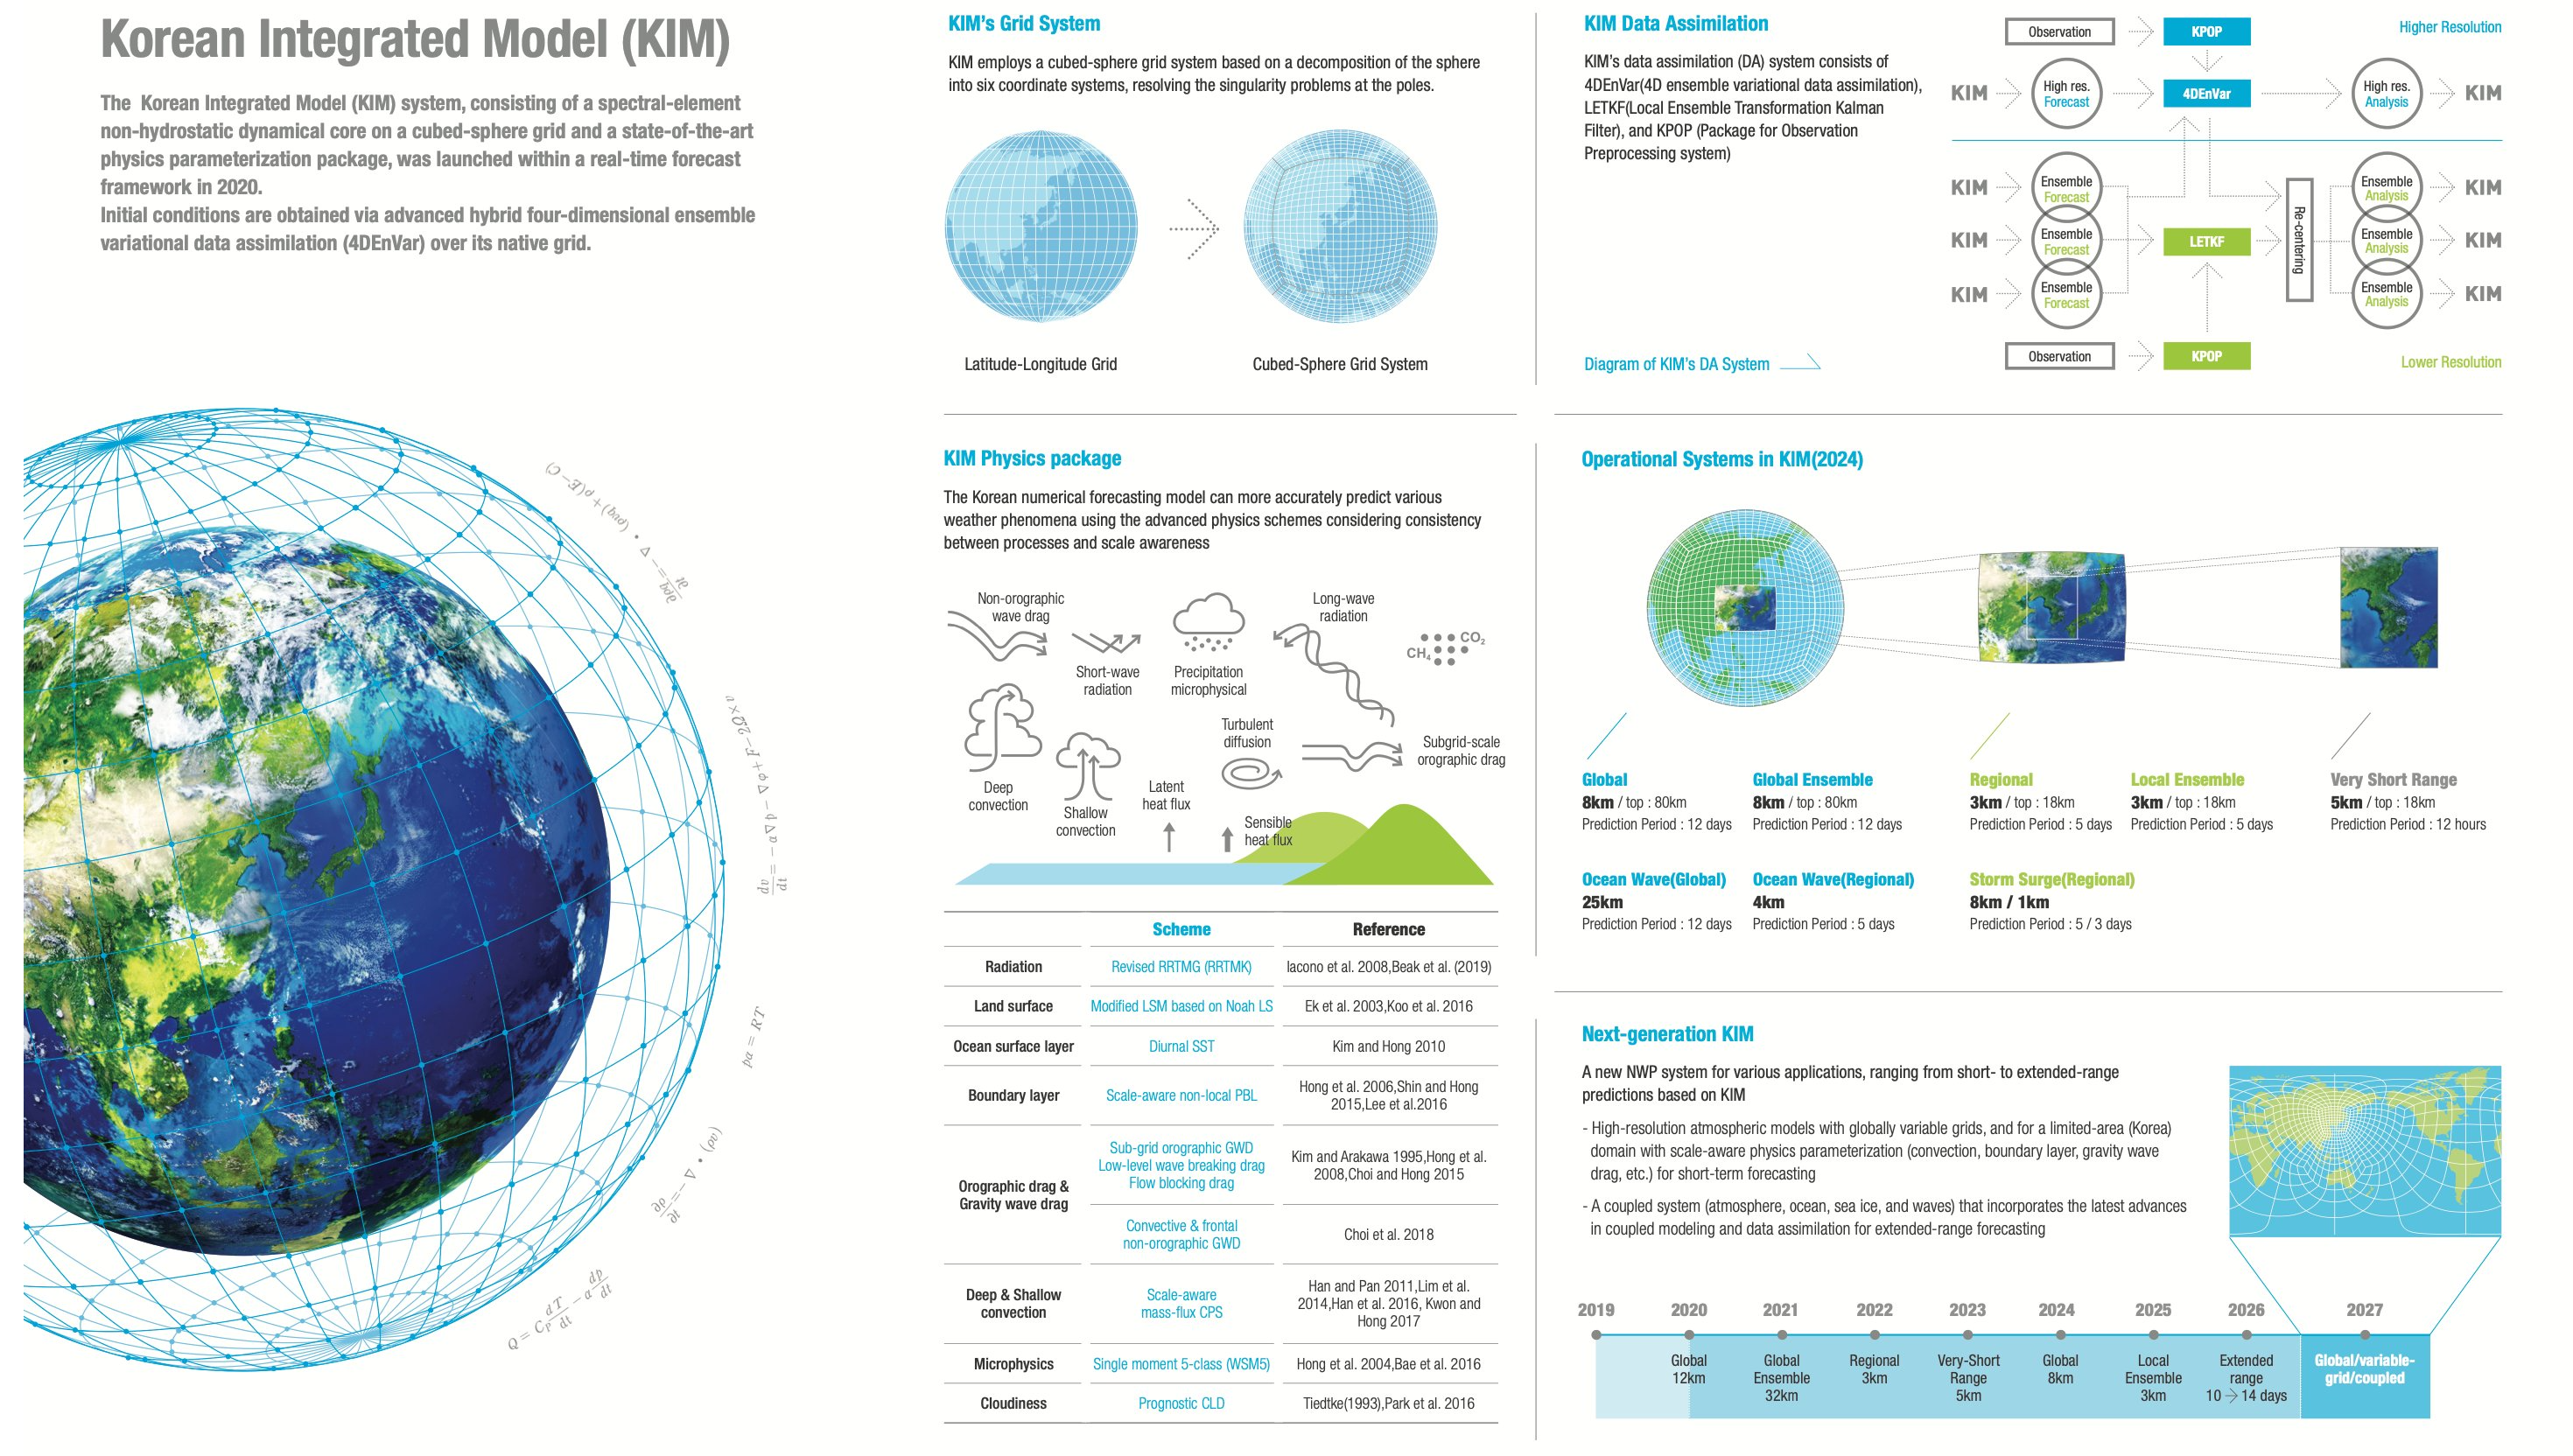
Our three key limitations are exactly what KMA's operational Korean Integrated Model (KIM) has been built to solve.

LIMITATION 01 → KIM SOLUTION
Time-Independent DA → Cycled 4DEnVar

KIM runs a 6-hour cycled 4DEnVar system — each analysis feeds into the next cycle, creating true temporal continuity.

LIMITATION 02 → KIM SOLUTION
Ensemble Collapse → Hybrid Covariance

KIM blends ensemble and static background error covariance — when ensemble spread collapses, the static component compensates.

LIMITATION 03 → KIM SOLUTION
H = I Assumption → Dedicated Obs. Operators

KIM applies tailored observation operators for each data type with spatial interpolation and bias correction. The 8km upgrade further reduced grid-observation mismatch.

KIM's 8km upgrade (2022) showed the most notable improvements for heatwaves and typhoons — validating our finding that DA matters most during extreme events.
KIM system diagram
SOURCE: KIAPS · Korean Integrated Model (KIM) system overview — DA pipeline, grid system, and operational configurations (2024)